


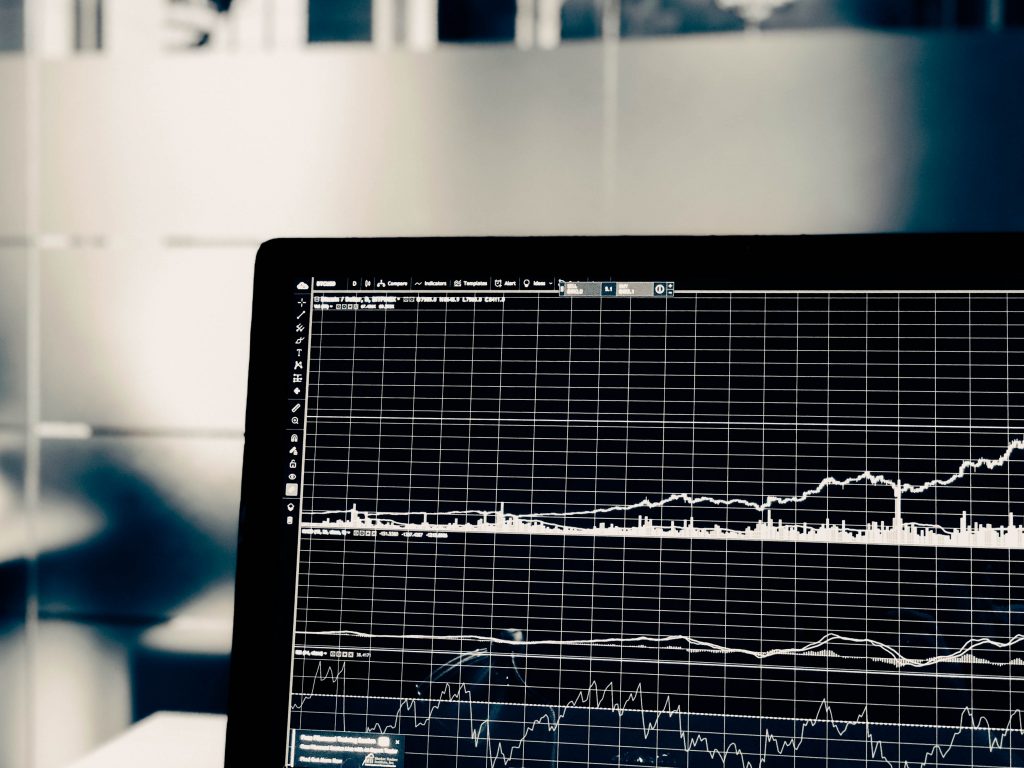
In the stock market, buyers and sellers come together to conduct stock trades, much like a physical marketplace. However, instead of goods, the stock market facilitates the buying and selling of shares of publicly traded companies. When you purchase a stock, you gain a fractional ownership in that company. As a shareholder, you earn money when the share price appreciates and may incur losses when the price declines.
Today, stock markets have evolved into vast financial hubs. The market capitalization—the total value of all outstanding shares of listed companies—typically measures the size of the market. Investors buy shares primarily for capital appreciation, expecting their investments to grow over time.
Having proper knowledge and experience is essential to identify the right stocks to invest in. Stock analysis plays a critical role in selecting the best stocks to trade, allowing investors to make informed decisions.
Fundamental Analysis
Fundamental analysis involves examining a company’s financial health and underlying factors that influence its stock price. This includes evaluating internal metrics such as profits, losses, revenue, and company news. Analysts also consider broader economic conditions to predict future stock price movements. Typically applied to long-term investing, the goal is to determine the intrinsic value of a stock. Decisions are data-driven and based on accessible information such as industry statistics, economic reports, and relevant news stories.
Technical Analysis
Unlike fundamental analysis, technical analysis does not focus on a company’s financial performance or economic conditions. Instead, it analyzes historical stock price movements through daily charts using various technical indicators. These indicators help predict future price movements based on past data. Mastery of technical analysis requires extensive knowledge and experience in interpreting chart patterns and price trends. Investors often select specific indicators that suit their trading style and expertise.
Technical analysis is especially useful for short-term investors aiming to identify optimal entry and exit points. It relies solely on past price data and market trends, utilizing chart patterns and indicators to forecast future stock prices.
Candlestick Patterns
Candlestick patterns Candlestick charts are among the most widely used tools in technical analysis. These charts display price changes in stocks over specific time frames, packing information into easily interpretable bars. Unlike simple open, high, low, close (OHLC) bars or closing price line charts, candlesticks reveal patterns that can help predict price direction when completed. Originating from 18th-century Japanese rice traders, candlestick charts use color coding to provide added depth and insight into market sentiment.
Traders use a variety of candlestick patterns to gauge market momentum. Combining multiple technical indicators often improves the accuracy of stock movement predictions. These tools are vital for short-term investors focused on finding the right moments to enter or exit trades based on historical price data and market developments.
Candlestick patterns typically fall into two categories: bullish and bearish. Each pattern helps traders interpret potential market reversals or continuations.
Bullish/Bearish Engulfing Lines
Engulfing lines are powerful indicators of potential trend reversals. A bearish engulfing pattern occurs after an uptrend, where a large candle engulfs the previous candle’s body in the opposite direction, signaling a possible downward reversal. This often means buyers’ upward momentum has weakened and sellers are gaining control.
Conversely, a bullish engulfing pattern forms after a downtrend, indicating the start of upward momentum as buyers begin to dominate market action.
Hanging Man
The hanging man candlestick pattern signals a potential bearish reversal following an uptrend. It forms when selling pressure emerges after several bullish days, creating a candle with a long lower wick and a small body positioned near the top. Confirmation usually comes from a bearish candle on the subsequent trading day, indicating sellers have taken control.
Doji and Spinning Top
A Doji candlestick forms when the opening and closing prices are virtually the same, indicating indecision among traders. Spinning tops are similar but have a small real body and longer wicks, reflecting a balanced battle between buyers and sellers. Both patterns often precede market reversals or pauses.
Hammer
The hammer pattern typically appears at the end of a downtrend, suggesting a potential reversal. It signals that buyers are beginning to overcome selling pressure, marked by a small body near the top and a long lower wick.
Abandoned Baby Top/Bottom
Also known as an island reversal, the abandoned baby pattern forecasts a significant reversal after a sustained trend. It is characterized by a gap that isolates a small-bodied candle at the trend’s peak or trough, resembling an island. Confirmation comes from a strong candle in the opposite direction on the following day.
Incorporating candlestick pattern analysis into your trading strategy can vastly improve your ability to interpret market signals and make profitable decisions. However, possessing knowledge of these patterns is just one piece of the puzzle. Selecting the right best forex broker is crucial. The best forex brokers offer advanced trading platforms equipped with comprehensive charting tools, excellent customer support, and educational resources. These features are essential to help you refine your trading strategies and optimize trading outcomes. By combining technical analysis skills with a reliable broker, you enhance your capacity to capitalize effectively on market opportunities.
Continuous learning and practical experience are key to mastering stock market trading. Alongside technical and fundamental analysis, keeping an eye on global economic trends, company news, and geopolitical developments will provide a more holistic understanding of market movements. Moreover, risk management strategies, including proper diversification and setting stop-loss orders, are critical to protect your investments from unexpected volatility. Embracing a disciplined approach and remaining patient can significantly boost your trading success and long-term financial growth.